Chart surface
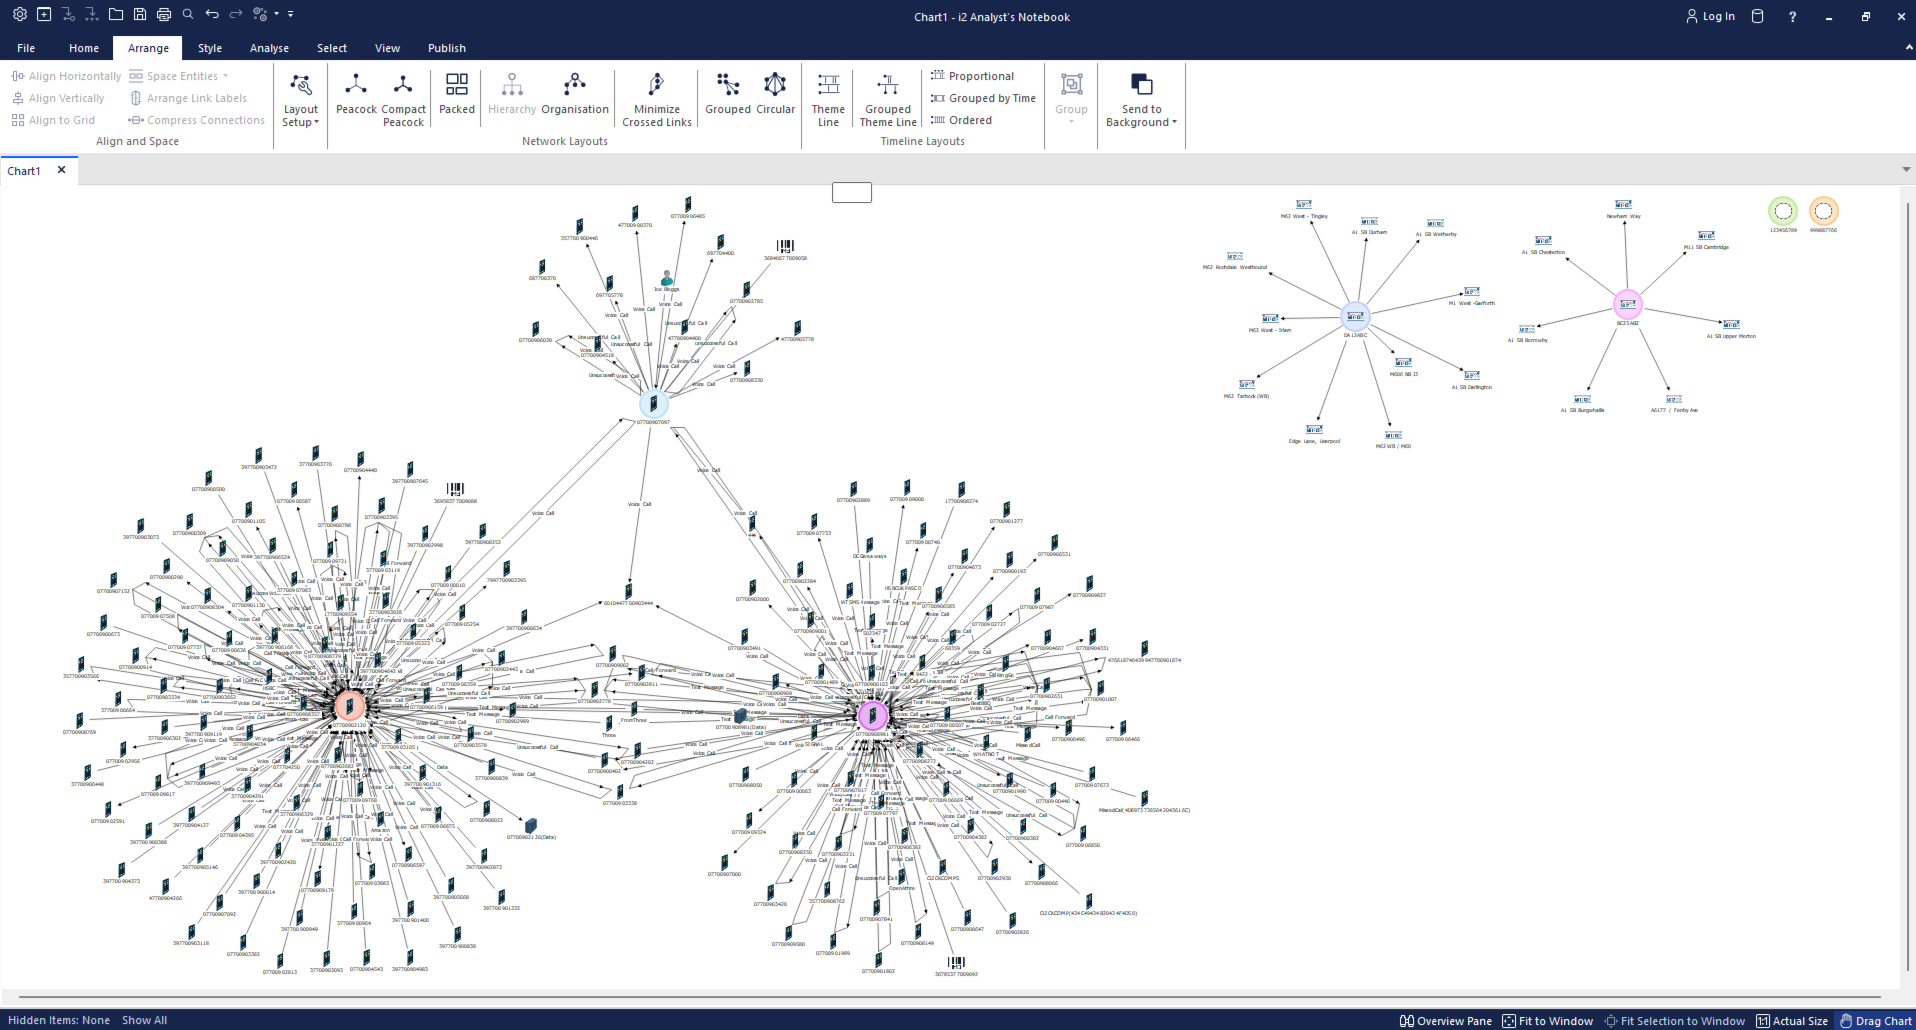
The Analyst's Notebook chart surface is a live output of your i2 Insights analysis. As you import data into Insights, it is automatically standardized, normalized, and sent to the chart surface, where entities and the links between them are rendered as chart items. This means that relationships and patterns identified in your data become immediately visible on the chart without you having to manually build it.
The chart surface updates dynamically in response to selections you make in the other Insights panels. When you select a specific event or entity in the Intelligence View, the corresponding items are highlighted on the chart, allowing you to move fluidly between analytical views and the chart without losing context.
Entities that you toggle on or off in the Entities view are also added to or removed from the chart surface accordingly, giving you precise control over which data points are represented. Any attributes you have associated with entities, such as a name or label, are carried through and displayed on the chart items, making the chart easier to read and interpret.