
Maps
The Maps view uses i2 Maps and provides a spatial representation of your data. This allows you to visualize and analyze geographic patterns and relationships. The Maps view is interactive, enabling you to explore your data in a spatial context.
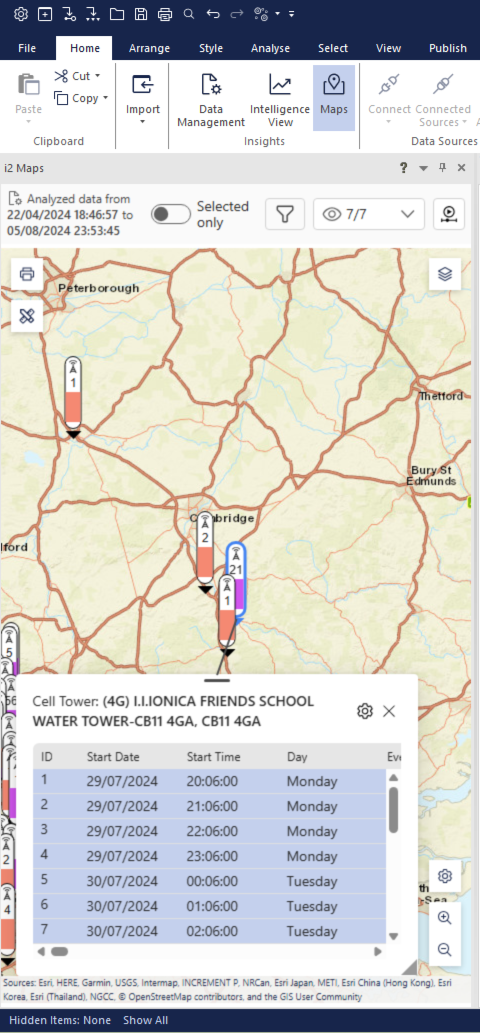
Like the other panels in Insights, the Maps view updates based on your selections. Maps has filter and show/hide options that enable you to focus on specific data points or patterns. You can also use the Selected only toggle at the top of the map to show only the data points that you have selected in the Intelligence View.
If Insights identifies possible co-locations, it will group them together in the Intelligence View. You can click on the group to find the location on the map.
Playback
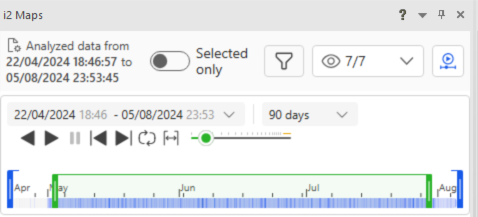
The playback feature lets you animate events on the map over time. Click the playback icon in the map header to enable playback mode.
A timeline appears below the map header, with a density heatmap showing event activity. You can drag the handles to set the overall time range, and a sliding playback window moves through that range as the animation runs. You can configure the playback window size and unit (for example, 1 day), and set a specific playback start date and time, by clicking the date range shown in the playback bar.
The playback controls let you:
Play or Play Reverse — animate forward or backward through time
Pause — stop the animation
Skip to Start or Skip to End — jump to the beginning or end of the range
Loop — replay continuously when the end of the range is reached
Fit to View — reset the range to the full data interval
Speed Slider — control how fast the animation runs
As the animation plays, map markers reflect the current playback window. Markers for events within the active window are fully visible, markers in adjacent frames are shown at reduced opacity, and all other markers are hidden. Detail pop-ups are not shown during active playback.
Marker details
When you click a marker on the map, a details panel opens showing the data associated with that location. You can customize the columns displayed in the marker details panel by clicking the gear icon to open the Columns dialog, where you can search, show or hide columns. To rename a column, double-click the column name. You can reorder and resize columns, and your preferences are saved for each view. You can also save default views with reduced columns, and restore full visibility when needed.
Configuration
Maps can be configured using the Layer settings and Map settings options. Layer settings allow you to control the visibility and appearance of individual data layers on the map. Map settings allow you to configure broader map behavior, such as the base map style and clustering options.