
Following the data
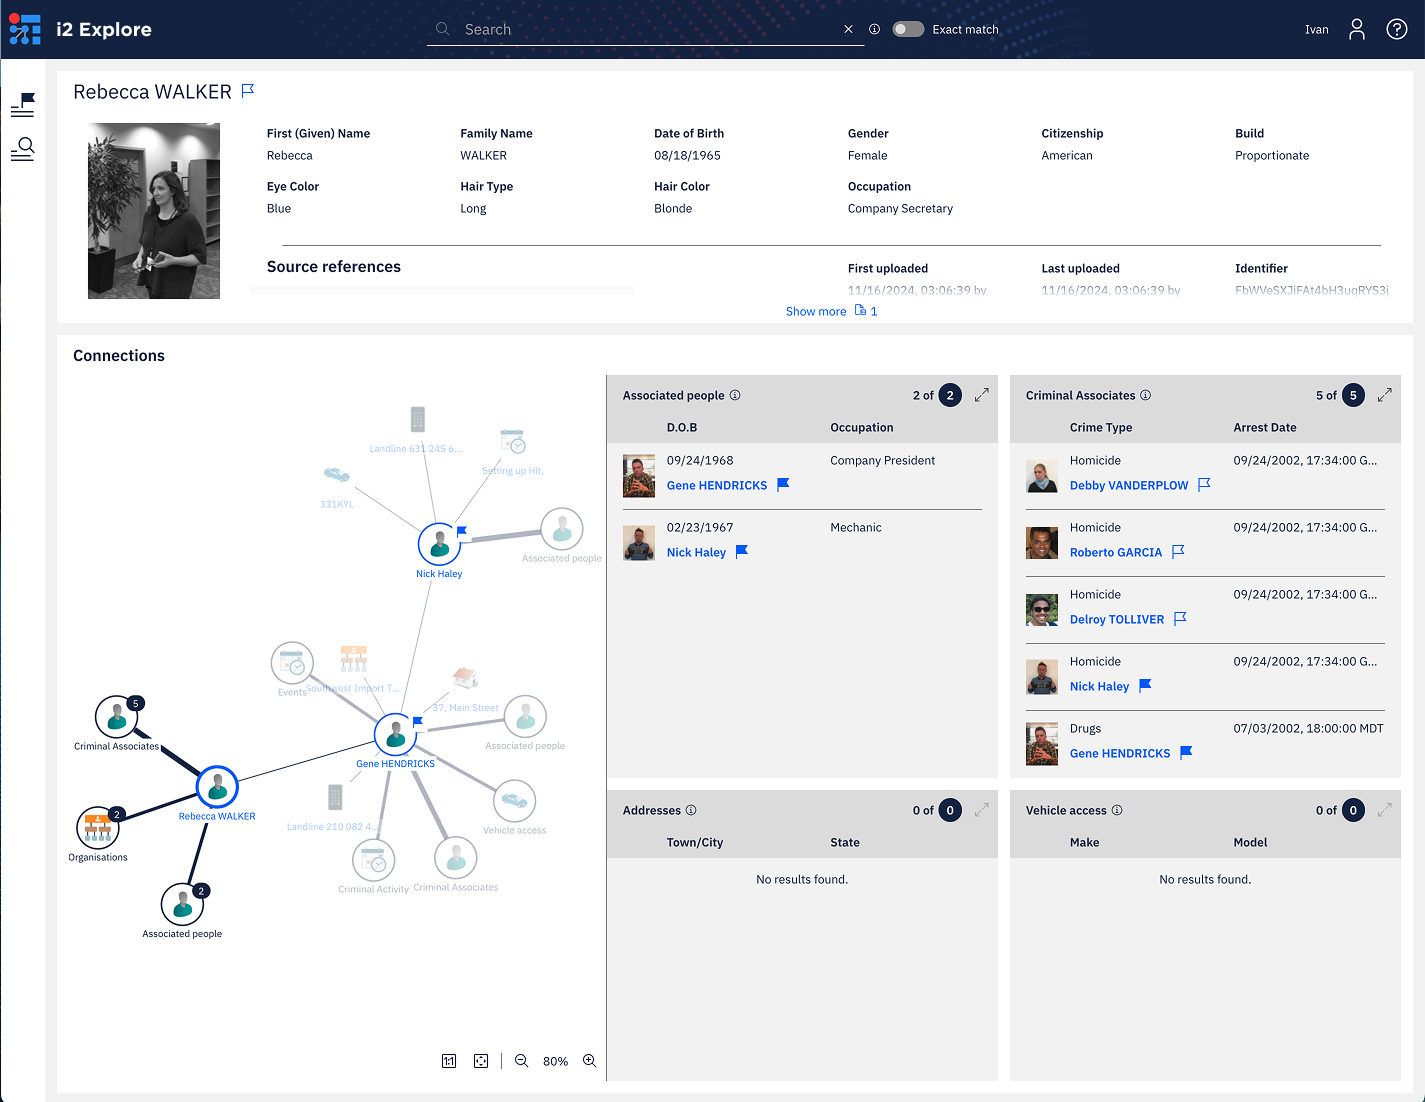
One way to examine the connections of a selected record is to use the visualization that i2 Explore displays on the left side of the screen. The visualization displays all the highlight panel results in a single view, in relation to the main record.
When a highlight panel contains a single record, it appears as a single node in the visualization. If there are multiple records in a panel, i2 Explore groups them together and shows the number of records.
To navigate data with the visualization:
Click any single record to switch your focus to that record.
In the example below, focus has switched from "Nick Haley" to "Gene Hendricks" and then to "Rebecca Walker".
Previously visited records remain in the visualization until you return to the Search results or Flagged records pages.
Return to any record that you have previously visited by clicking it.
i2 Explore shows the relationships of the record you clicked on, and the visualization re-centers on that record.
If you need to expand one of the groups in the visualization, select records in the corresponding highlight panel.