
Viewing chart data on a map
The data you that work with in the Web Client can include latitude and longitude information. By default, when you add this data to a chart, the Web Client opens its Maps window and displays the data on a map.
The markers in the Maps window provide a different way to visualize your data. You can see where things are happening in relation to each other.
If the Maps window is not open, click Maps on the ribbon's home tab to open it.
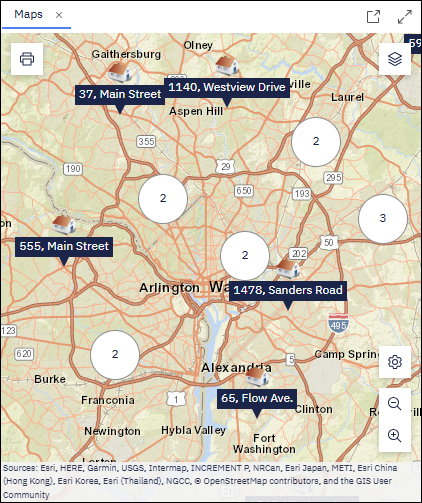
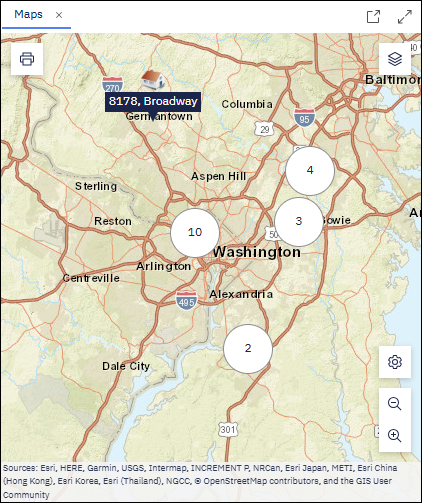
Depending on the scale of the map, the Web Client groups markers together in clusters. Zoom in or out to change the cluster sizes.
Use the connection between the chart and the map to explore your data:
- Click a marker on the map to select the corresponding entity on the chart.
- Select an entity on the chart to highlight the corresponding marker on the map.
Simplify the map by right-clicking markers and selecting Remove.
To replace a marker, right-click the entity on the chart and select Add to map.
To print your current view of the map, click Print in the upper left corner of the Maps window.
In the browser's Print dialog, ensure that the Background graphics (or similar) option is selected.