Creating entities on a chart
If you have a small amount of data that you want to visualize or present; or if you want to add some data to a chart that you've already started, you can create entities and links to represent that data directly in the Web Client.
To create entities on a chart, you use the palette, which contains icons for the types of entities that you can add:
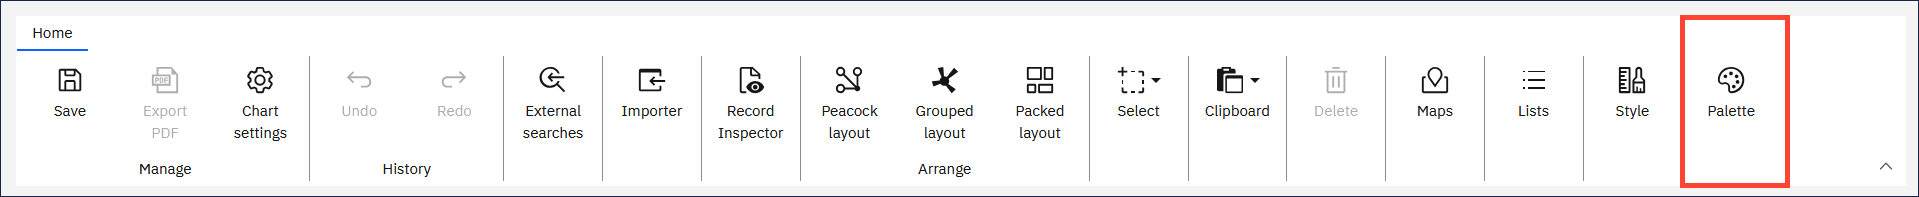
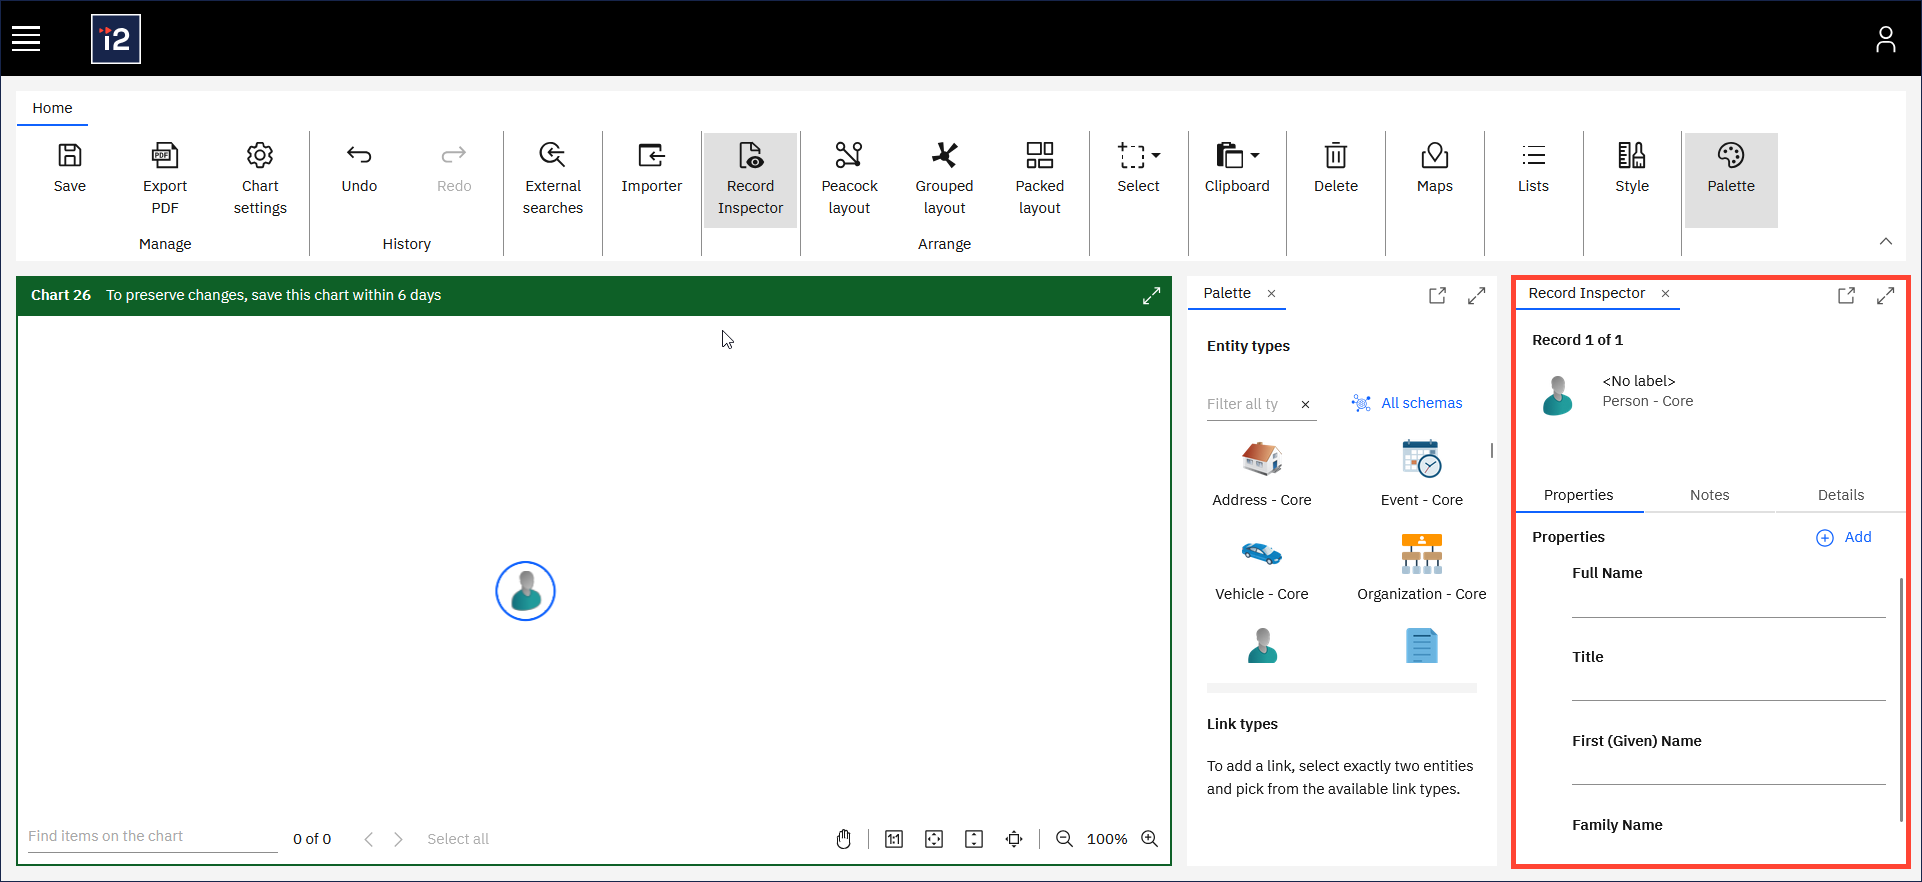
On the ribbon's Home tab, click Palette.
The Palette window opens.
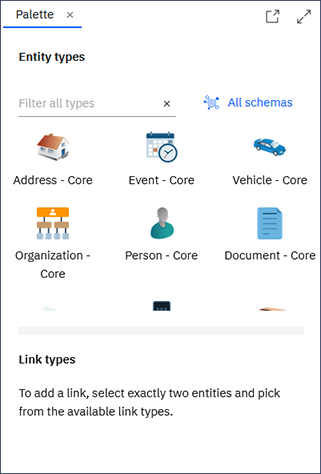
Select an entity type from the palette and then drag it onto the chart.
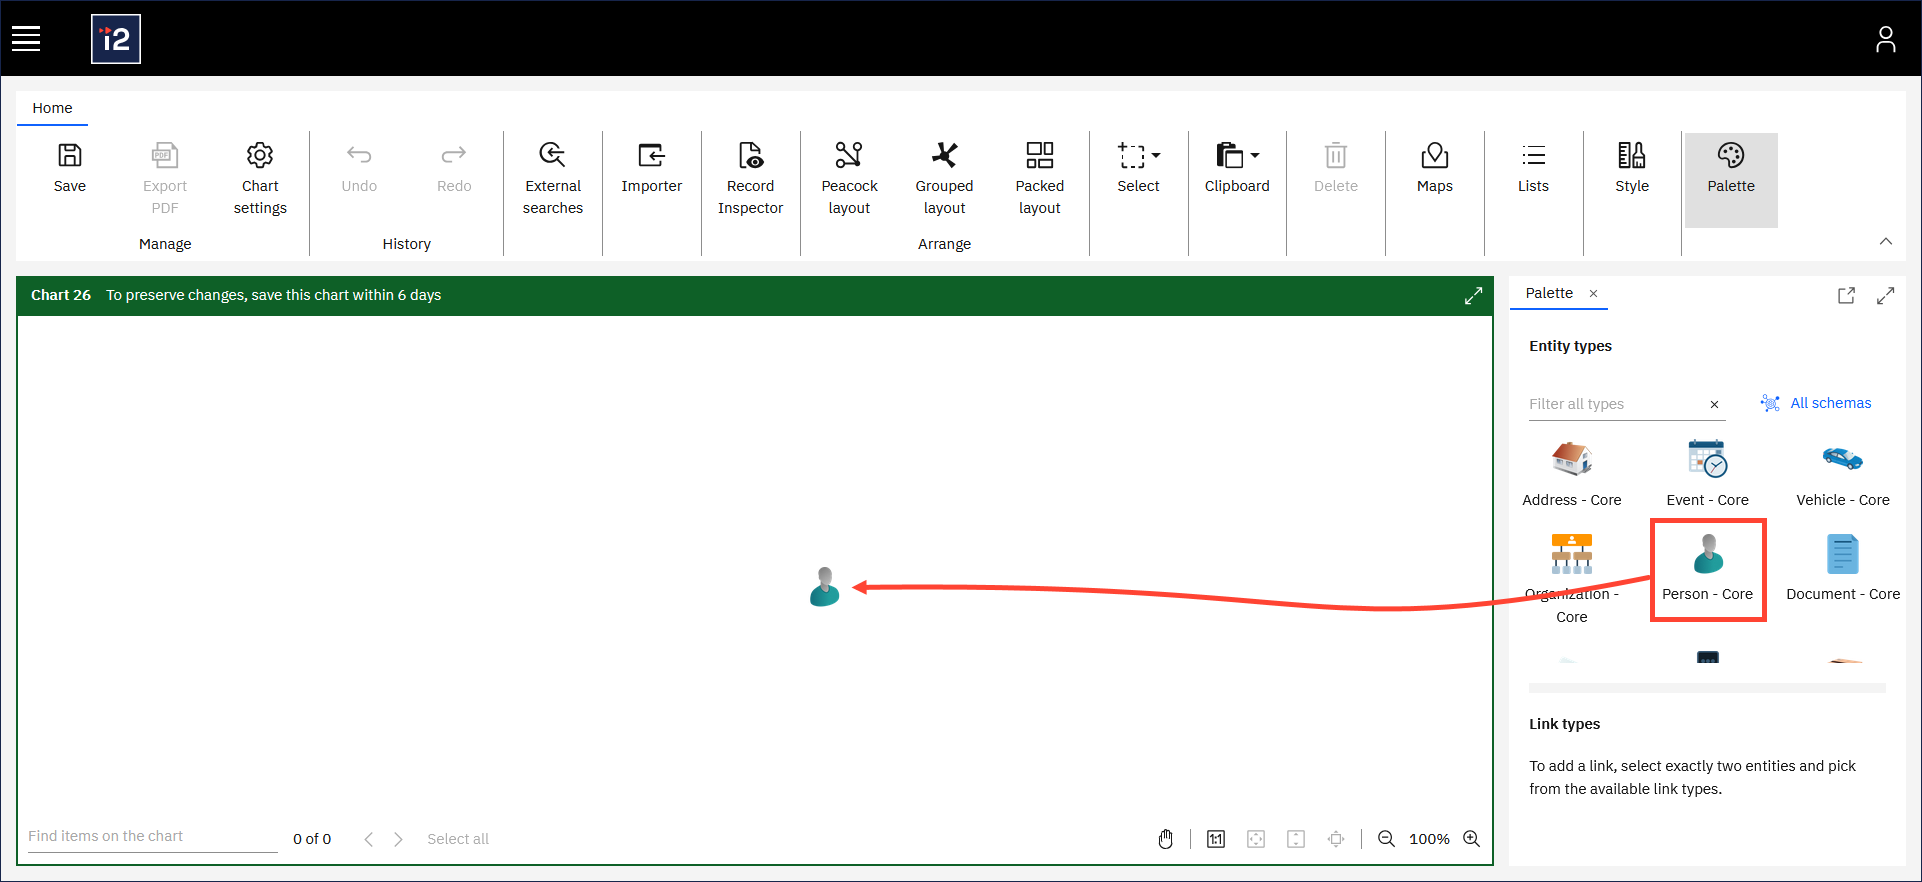
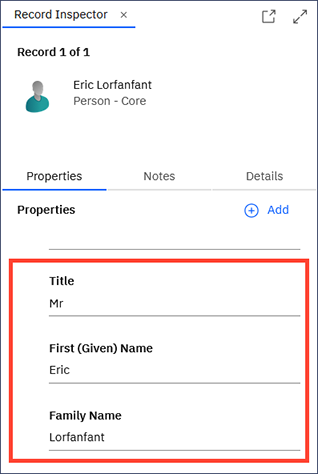
The entity is added to the chart and the Record Inspector opens. You can use the Record Inspector to add information that you know about that entity - for example the name of a person. These pieces of information are the properties of the entity.
In the Record Inspector, choose a property and enter a value.
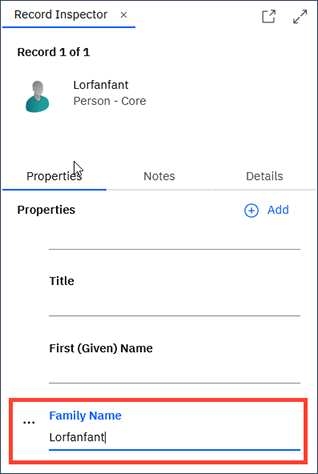
Add values to the other properties as you need.