
Setting link styles
For any of the expansion operations, you can define the style for the links which are added to the chart. You can decide what the label of the link should be and set whether to chart multiple links between two entities as individual links or merge them together.
There are two ways that you can specify the link style to
use:
- In the New or Selection pages of the Data Sources Task Pane, see Setting up Association and Timeline options.
-
In the Charting Settings:
-
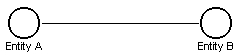
Select the style in the Connection Style area:
- Single is one link between the two
entities. Multiple links in the database between the two
entities will be compressed into one link on the chart.
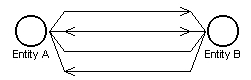
- Directed is up to one link in each of the
four directions (no arrow, arrow on one end, arrow on the other
end, arrows on both ends). Multiple links in the same direction
in the database between the two entities will be compressed into
one link on the chart, resulting in a maximum of one link in
each of the four directions.
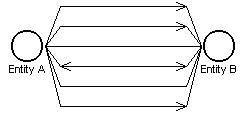
- Multiple is any number of links in any
direction. Each link in the database will be charted
individually.
 Note: At any time, you can reset all of the options on the Charting Settings dialog back to their default settings by clicking Reset.
- Single is one link between the two
entities. Multiple links in the database between the two
entities will be compressed into one link on the chart.
-
Select the style in the Connection Style area: