
Running Prometheus and Grafana
i2 Analyze and its components provide a number of metrics through REST endpoints. You can use Prometheus to monitor your deployment, and Grafana to visualize the captured data.
About this task
To monitor your deployment of i2 Analyze, complete the following actions:
Update the i2 Analyze configuration to enable metrics reporting
Configure and run Prometheus and Grafana
View the monitoring reports in Grafana using the provided dashboards
To configure your Prometheus and Grafana instances, use your configuration development environment. When the tools are configured to meet your requirements, you can update them to match the security requirements of your production system.
Complete the following steps to enable metrics on i2 Analyze, and configure and install the monitoring tools.
Procedure
Configure i2 Analyze.
Uncomment the monitoring features and non-SSL elements in the Liberty server.extensions.xml file. The file is located in the toolkit/configuration/liberty directory.
For example:
<server>
    <featureManager>
        <feature>mpMetrics-1.1</feature>
        <feature>monitor-1.0</feature>
    </featureManager>

    <mpMetrics authentication="false"/>
</server>
To enable i2 Analyze metrics, in the toolkit/configuration/fragments/opal-services/WEB-INF/classes/DiscoServerSettingsCommon.properties file, set the EnableMetrics property to true.
For example:
EnableMetrics=trueRun the following command on your Liberty server to update the application with your changes.
setup -t deployLiberty
Configure and run Prometheus.
When you start Prometheus, you must reference a configuration file. The i2 Analyze deployment toolkit includes a template Prometheus configuration file that contains configuration to enable monitoring of Liberty and i2 Analyze. The prometheus.yml file is in the toolkit/examples/prometheus directory.
In the prometheus.yml file, update the values to match your environment:
Replace <liberty_domain>:<port> with the fully qualified domain name and port of your Liberty server.
For example, i2analyze.eia:9082
Note: When Liberty is not running in Docker and Prometheus is running in a Docker container hosted on the same machine, use the following value for <liberty_domain>: host.docker.internal.
If you are using the opal-daod deployment pattern, update the metrics_path to /opaldaod/api/v1/metrics.
After you complete the configuration file, install and run Prometheus with your configuration. In this example we install and run Prometheus using Docker, but you can install it in a number of ways. For more information about installing Prometheus, see Prometheus installation.
If you have Docker installed, run the following command to run Prometheus with your configuration on Docker:
docker run -d
    -p 9090:9090
    --network=<network_name>
    -v "/<path_to>/prometheus.yml:/etc/prometheus/prometheus.yml"
    prom/prometheus
Where:
<network_name> is the name of a Docker network for the container to run on. For more information about creating a Docker network, see Docker network.
<path_to> is the path with your updated prometheus.yml file. For example, toolkit/examples/prometheus.
Configure and run Grafana.
The i2 Analyze deployment toolkit includes a template Grafana data source configuration file and dashboards. The prometheus-datasource.yml file is in the toolkit/examples/grafana/provisioning/datasources directory.
In the prometheus-datasource.yml, replace <prometheus_domain>:<port> with the host name and port of your Prometheus server.
The quickest way to install Grafana is by using Docker, but you can install it in a number of other ways. For more information about installing Grafana, see Install Grafana.
If you have Docker installed, run the following command to run Grafana on Docker:
docker run -d
    --name "grafana"
    -p "3000:3000"
    --network=<network_name>
    -v "<grafana_data>:/var/lib/grafana"
    -v "<grafana_provisioning_dashboards>:/etc/grafana/provisioning/dashboards"
    -v "<grafana_provisioning_datasources>:/etc/grafana/provisioning/datasources"
    -v "<grafana_dashboards>:/etc/grafana/dashboards"
    "grafana/grafana-oss"
Where:
<network_name> is the name of a Docker network for the container to run on. Prometheus and Grafana must be able to communicate with each other. When both are running in Docker, ensure they are running on the same Docker network. For more information about creating a Docker network, see Docker network.
<grafana_data> is a path to store Grafana data.
<grafana_provisioning_dashboards> is the path to your dashboard provisioning files. For example toolkit/examples/grafana/provisioning/dashboards. For more information, see Provisioning dashboards.
<grafana_provisioning_datasources> is the path to your data source configuration files. For example toolkit/examples/grafana/provisioning/datasources. For more information, see Provisioning data sources".
<grafana_dashboards> is the path to your dashboard files. For example toolkit/examples/grafana/dashboards/provisioning.
You can import your own dashboards into Grafana, to do this you must start Grafana with a different command. For more information, see Importing Grafana dashboards
What to do next
Connect to the Grafana UI to review the dashboards. In a browser, navigate to your Grafana instance. For example, http://localhost:3000/dashboards.
By default, Grafana includes an admin user that you can use to log in. The user name is "admin" and the password is "admin".
If you have chosen to manually import your dashboards, complete the steps in Importing Grafana dashboards to see the example dashboards.
The toolkit includes the following example dashboards:
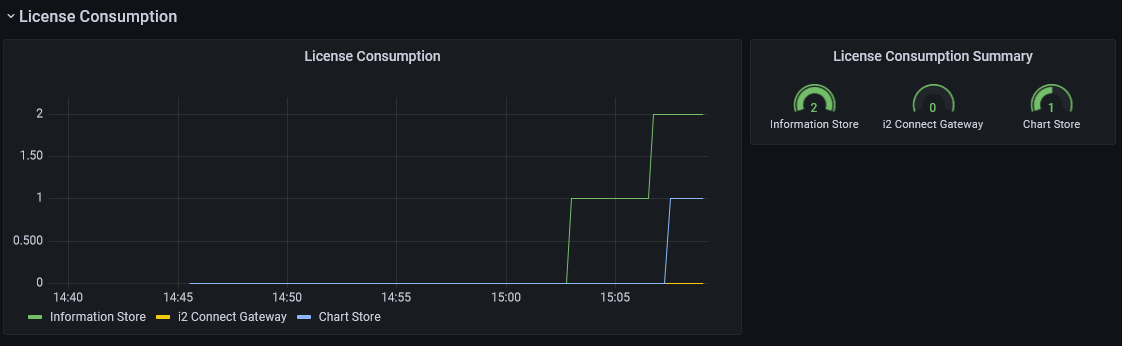
The "i2 Analyze License Reporting" dashboard reports on the usage of your system by analysts. For example: User Activity, Privacy Agreement Count, and License Consumption. For example:
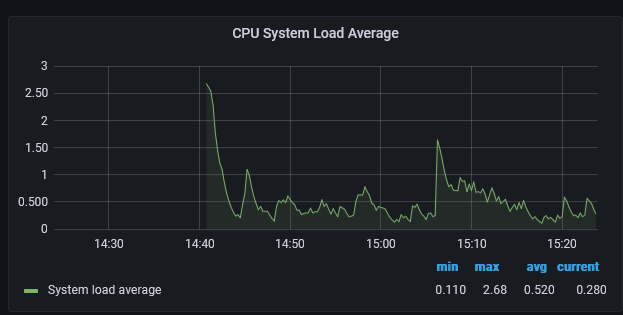
The "Liberty-Metrics" dashboard reports on the hardware usage of the Liberty server. For example: CPU Load, Heap Usage, and JVM Uptime. For example:
You can extend the example configuration to meet your requirements.
To run Prometheus and Grafana in production, you might want to configure authentication, authorization, and other features. You can use the Prometheus and Grafana documentation to determine how to configure these features.
When you move into pre-prod and production deployment, you might be deploying with TLS. You can configure Prometheus to communicate with Liberty via TLS by modifying the prometheus.yml file:
To configure TLS, you must provide a CA certificate that trusts the certificate received from the Liberty server.
You must also update the scheme value for the Liberty job to use the value https
You can configure user authentication:
For the complete documentation, see:
Importing Grafana dashboards
If you would rather import dashboards than have them already set up when you start Grafana, start your container without the dashboard and datasource volumes.
To start the Grafana container without the dashboard and datasource volumes, run:
docker run -d
    --name "grafana"
    -p "3000:3000"
    --network=<network_name>
    -v "<grafana_data>:/var/lib/grafana"
    "grafana/grafana-oss"
After Grafana is started, connect to the Grafana UI and log in By default, Grafana includes an admin user that you can use to log in. The user name is "admin" and the password is "admin". Navigate to Import dashboard -> Dashboards -> Grafana and import your dashboard. Some example dashboards are provided in the toolkit/examples/grafana/dashboards/import-configurations directory.
After a dashboard is imported, you must create a datasource for your dashboard to connect to. The example import-configurations require a Prometheus datasource with the name "prometheus". Navigate to Add data source -> Data sources -> Connections -> Grafana and select the Prometheus datasource. Specify the name "prometheus" and the connection url for your Prometheus instance. If you are using the container example from earlier, the URL will be similar to: http://prometheus.eia:9090.
The default settings can be left unchanged. Navigate to the bottom of the page and click Save & Test. The UI displays that the source has been connected to successfully.