Running Prometheus and Grafana

i2 Analyze and its components provide a number of metrics through REST endpoints. You can use Prometheus to monitor your deployment, and Grafana to visualize the captured data.

To monitor your deployment of i2 Analyze, complete the following actions:
  • Update the i2 Analyze configuration to enable metrics reporting
  • Configure and run Prometheus and Grafana
  • View the monitoring reports in Grafana using the provided dashboards
To configure your Prometheus and Grafana instances, use your configuration development environment. When the tools are configured to meet your requirements, you can update them to match the security requirements of your production system.

Complete the following steps to enable metrics on i2 Analyze, and configure and install the monitoring tools.

  1. Configure i2 Analyze.
    1. Uncomment the monitoring features and non-SSL elements in the Liberty server.extensions.xml file. The file is located in the toolkit/configuration/liberty directory.
      For example:
      <server>
        <featureManager>
          <feature>mpMetrics-1.1</feature>
          <feature>monitor-1.0</feature>
        </featureManager>
      
        <mpMetrics authentication="false"/>
      </server>
    2. To enable i2 Analyze metrics, in the toolkit/configuration/fragments/opal-services/WEB-INF/classes/DiscoServerSettingsCommon.properties file, set the EnableMetrics property to true.
      For example:
      EnableMetrics=true
    3. Run the following command on your Liberty server to update the application with your changes.
      setup -t deployLiberty
  2. Configure and run Prometheus.
    When you start Prometheus, you must reference a configuration file. The i2 Analyze deployment toolkit includes a template Prometheus configuration file that contains configuration to enable monitoring of Prometheus, Liberty, and i2 Analyze. The prometheus.yml file is in the toolkit/examples/prometheus directory.

    In the prometheus.yml file, update the values to match your environment:

    1. Replace <liberty_domain>:<port> with the fully qualified domain name and port of your Liberty server.
      For example, `i2analyze.eia:9082`
      If you are using the opal-daod deployment pattern, update the metrics_path to '/opaldaod/api/v1/metrics'.
    2. Replace <prometheus_domain>:<port> with the host name and port of your Prometheus server.
      For example, `127.0.0.1:9090`
    3. Replace the <username> and <password> entries for each job.

      For the i2 Analyze and Liberty jobs, the user must be able to authenticate with your deployment of i2 Analyze.

    After you complete the configuration file, install and run Prometheus with your configuration. In this example we install and run Prometheus using Docker, but you can install it in a number of ways. For more information about installing Prometheus, see Prometheus installation.
    1. If you have Docker installed, run the following command to run Prometheus with your configuration on Docker:
      docker run -d -p 9090:9090 -v 
        "/<path_to>/prometheus.yml:/etc/prometheus/prometheus.yml"
        prom/prometheus
      Where <path_to> is the path with your updated prometheus.yml file. For example, toolkit/examples/prometheus.
  3. Configure and run Grafana.
    The i2 Analyze deployment toolkit includes a template Grafana data source configuration file and dashboards. The prometheus-datasource.yml file is in the toolkit/examples/grafana/provisioning/datasources directory.
    1. In the prometheus-datasource.yml, replace <prometheus_domain>:<port> with the host name and port of your Prometheus server.
    The quickest way to install Grafana is by using Docker, but you can install it in a number of other ways. For more information about installing Grafana, see Install Grafana.
    1. If you have Docker installed, run the following command to run Grafana on Docker:
      docker run -d 
         --name "grafana" 
          -p "3000:3000" 
          -v "<grafana_data>:/var/lib/grafana"
          -v "<grafana_provisioning_dashboards>:/etc/grafana/provisioning/dashboards"
          -v "<grafana_provisioning_datasources>:/etc/grafana/provisioning/datasources"
          -v "<grafana_dashboards>:/etc/grafana/dashboards"
          "grafana/grafana-oss" 
      Where:
      • <grafana_data> is a path to store Grafana data.
      • <grafana_provisioning_dashboards> is the path to your dashboard provisioning files. For example toolkit/examples/grafana/provisioning/dashboards.

        For more information, see Provisioning dashboards.

      • <grafana_provisioning_datasources> is the path to your data source configuration files. For example toolkit/examples/grafana/provisioning/datasources.

        For more information, see Provisioning data sources.

      • <grafana_dashboards> is the path to your dashboard files. For example toolkit/examples/grafana/dashboards.

Connect to the Grafana UI to review the dashboards. In a browser, navigate to your Grafana instance. For example, http://localhost:3000/dashboards.

By default, Grafana includes an admin user that you can use to log in. The user name is "admin" and the password is "admin".

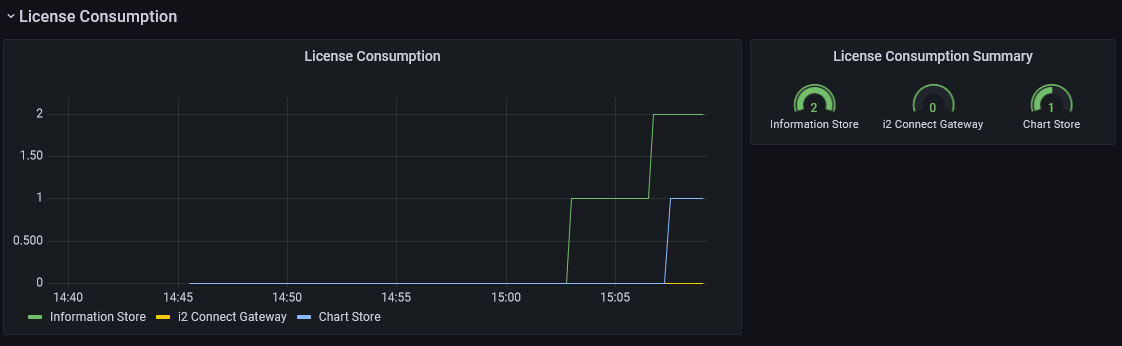
The toolkit includes the following example dashboards:
  • The "i2 Analyze License Reporting" dashboard reports on the usage of your system by analysts. For example: User Activity, Privacy Agreement Count, and License Consumption.
    For example:

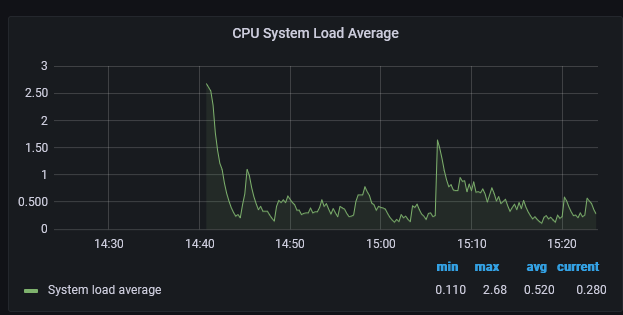
  • The "Liberty-Metrics" dashboard reports on the hardware usage of the Liberty server. For example: CPU Load, Heap Usage, and JVM Uptime.
    For example:

You can extend the example configuration to meet your requirements.

To run Prometheus and Grafana in production, you might want to configure authentication, authorization, and other features. You can use the Prometheus and Grafana documentation to determine how to configure these features.

For the complete documentation, see: